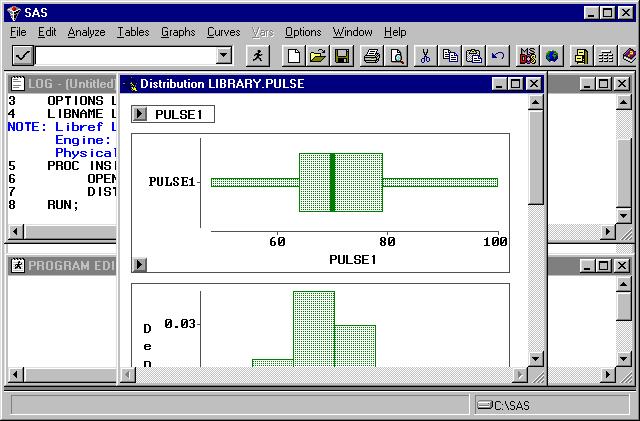
Since SAS/INSIGHT is intended to be interactive, this lesson will ask you to do everything interactively. Type the above commands into the SAS Program window and run it. The following window should appear:LIBNAME LIBRARY 'a:\'; PROC INSIGHT; OPEN LIBRARY.pulse / NODISPLAY; DIST pulse1; RUN;
Scroll through this window to examine what is displayed.
Click on the arrow icon at the bottom left of the pulse1 boxplot, then click VALUES. Note that the values of the quartiles, median, etc. appear on the graph. Try some of the other choices available on the arrow menu, for example, try SERIFS. Now try some of the other arrow icons and menu choices from this display to learn what you can do here.
Now click on the icon at the upper left corner of the INSIGHT window (just to the left of the words Distribution LIBRARY.pulse) to display another list of choices. The first choice on this list is MENU. Click MENU. Then click TABLES, CONFIDENCE INTERVAL FOR MEAN, then 95%. Now scroll down in the display to see the confidence interval you requested.
Click on the icon at the upper left corner of the INSIGHT window (just to the left of the words Distribution LIBRARY.pulse) again. Click MENU, CURVES, PARAMETIC DENSITY, OK(for normal). Then examine the display which now shows a normal distribution superimposed over the histogram for pulse1. Note that you can change the value of the mean and the distribution curve will move in response.
You can construct a Q-Q plot (normal quantile plot) for pulse1 by clicking on the icon at the upper left corner of the INSIGHT window (just to the left of the words Distribution LIBRARY.pulse) again. Click MENU, GRAPHS, Q-Q PLOT.
Click on the printer icon on the top SAS bar. Hand write your name on this page; this will be the first page of Homework #10 (there is one more page to include below).
Examine some of the other menu options to learn what is available.
SAS/INSIGHT is handy for exploring the regression relationship between two variables as well. To examine the relationship between y = pulse1 and x = weight click on the icon at the upper left corner of the INSIGHT window (just to the left of the words Distribution LIBRARY.pulse) again. Click MENU, ANALYZE, FIT(YX), click on PULSE1 then the Y icon, click on WEIGHT then the X icon, then click OK (you can do multiple regression by clicking additional variables into the X list). Your screen should look like the following:
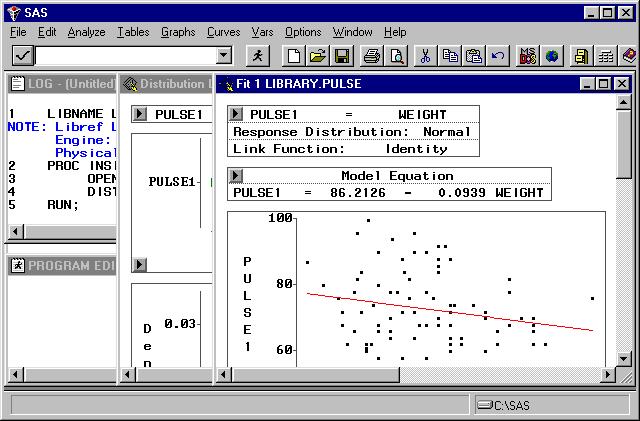
Scroll down and examine the full regression analysis produced including a plot of the residuals. Now find the DEGREE POLYNOMIAL section of this display and click the right arrow once. The degree of polynomial should change from 1 to 2. Scroll up to see that a quadratic equation, rather than a linear equation, has now been fit to the data. As you can tell SAS/INSIGHT is very powerful.
Click on the printer icon on the top SAS bar. Hand write your
name on this page; this will be the second page of your Homework # 10.
Please staple your pages together and turn them in to me.