Bit Correlations and Statistics

Computer Security Lecture, Dr. Lawlor

Basically the only thing you can do to analyze ciphertext is to look for patterns.  One place many patterns show up is in the statistics of the bytes.  For text ciphers, it's common to build text histograms, showing how often each letter occurs.  For binary data, a plain 1D histogram showing how often each byte occurs is also useful.

Bit Correlation

If the output data is truly 100% random, statistically every bit will be 0 half the time, and 1 half the time.  You can use XOR to measure how often any two bits are be different (because A^B is 1 where the bits are different, and 0 where the bits are the same), and on average they'll be different half the time as well.

Statisticians refer to this as "uncorrelated" data.  Every part of a cipher should be uncorrelated: no bit of the plaintext should correlate with any bit of the ciphertext, and no two bits of the ciphertext should be correlated with each other--any correlations indicate more random differences could be added, masking the ciphertext, and any correlations could be used as a fingerprint of the cipher to indicate what cipher is being used.

However, any instance of perfectly random data will have deviations from perfect randomness.  In fact, if I run a billion tests, and I get *exactly* half a billion 0's and half a billion 1's, this makes me instantly suspicious the output could be repeating itself.  There is one exception: if you scan the entire plaintext space, which is perfectly balanced between 0 and 1, the entire ciphertext space is typically also perfectly balanced, because typical ciphers are permutations (if a cipher has n bits of input, and n bits of output, and it's reversible, it must be a permutation).  I "discovered" this fact after my laptop spent half an hour scanning the entire 32-bit input space for RC5!

In theory, if the outputs from a cipher are independent (uncorrelated) and identically distributed (half 1, half 0), then the central limit theorem states the average approximates a normal distribution with variance:
    standard deviation of average = standard deviation of bits / sqrt(n bits)

As you increase the number of bits tested, n, the average bit balance should get closer and closer to 0.5.  Deviations of the average that are a large multiple of the standard deviation indicate the data is probably not independent or not identically distributed, either of which indicates a serious flaw in the cipher.

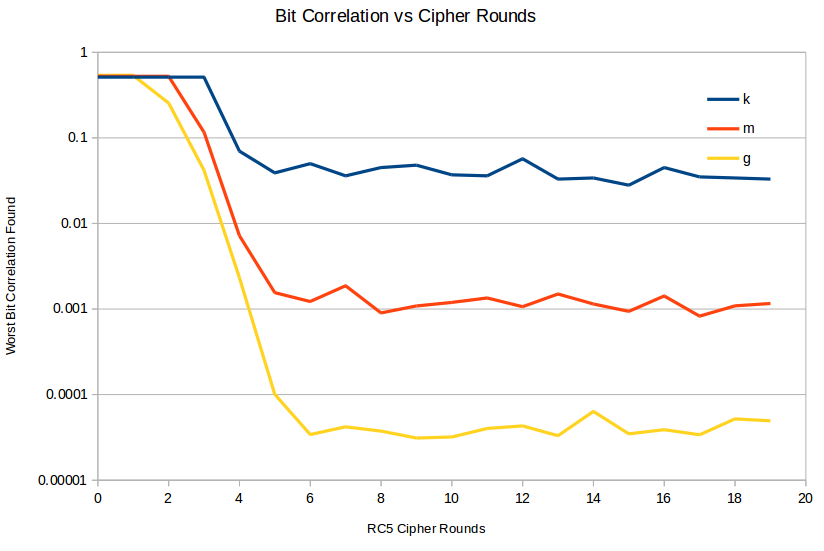
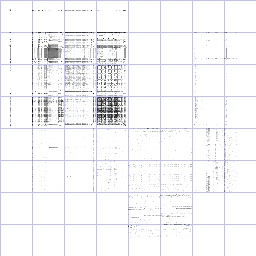
Here's a chart of the deviations from 0.5 measured for various RC5 round counts for various sample sizes: k for 1000 samples, m for 1000000 samples, and g for 1000000000 samples.  Clearly, below 4 rounds, the RC5 output has serious deviations from randomness.  Above about 6 rounds, the cipher seems OK, at least as measured by this test. 
Chart of bit correlation versus RC5 round count, showing
        short rounds have high correlation

2D Histogramming

The human eye can spot patterns that are difficult to predict beforehand, so it's common to build a 'coincidence table' showing how often values occur together as a 2D histogram image.  Here's a tiny C++ coincidence counting program, producing a 256x256 histogram:
/*
Binary file byte-coincidence histogramming tool.

Dr. Orion Sky Lawlor, lawlor@alaska.edu, 2013-01-28 (Public Domain)
*/
#include <iostream>
#include <fstream>
#include <string>
#include <cmath>

double clamp(double v) {
if (v<0.0) return 0.0;
if (v>1.0) return 1.0;
else return v;
}

class histo2d {
public:
enum {n=256}; // byte histogram
unsigned int data[n][n]; /* [first byte][next byte] */
int last;

histo2d() { // zero the histogram
for (int i=0;i<n;i++)
for (int j=0;j<n;j++)
data[i][j]=0;
last=-1;
}

void add(unsigned char next) {
if (last!=-1) data[last][next]++;
last=next;
}

void save(std::string filename)
{ // save to a PPM file
filename+=".ppm";
std::ofstream of(filename.c_str(),std::ios_base::binary);
of<<"P6\n"<<n<<" "<<n<<"\n255\n";

// Find the biggest value (to scale output to bytes)
unsigned int big=0;
for (int i=0;i<n;i++)
for (int j=0;j<n;j++)
if (data[i][j]>big) big=data[i][j];
double scale=1.0/big;

// Scale the output to bytes, and write them to disk.
for (int i=0;i<n;i++)
for (int j=0;j<n;j++)
{
unsigned char out=255*clamp(-0.1*log(data[i][j]*scale));

unsigned char out2=out;
if (((i&0x1f)==0 || (j&0x1f)==0))
out2*=0.75; // make grid lines
of.write((char *)&out2,1);
of.write((char *)&out,1);
}
}
};

int main(int argc,char *argv[]) {
if (argc<=1) {
std::cout<<"Usage: coincidence <input file...>\n";
return 1;
}

for (int argi=1;argi<argc;argi++) {
const char *fileName=argv[argi];
std::cout<<"Histogramming file "<<fileName<<"\n";
histo2d h;
std::ifstream file(fileName,std::ios_base::binary);
unsigned char c;
while (file.read((char *)&c,1)) h.add(c);
h.save(fileName);
}
}
(Try this on RC5 in NetRun now!)

The output of this program is a 
PPM image, a weird format I use because it's very easy to write to disk.  It's read and displayed by NetRun automatically if you name the file "out.ppm", or it's readable by The GIMP or many old UNIX tools.

In the output image, the X axis is the first byte, from 0 on the left to 255 on the right.  The Y axis is the value of the next byte, from 0 at the top to 255 at the bottom.  White indicates the value never happens; black indicates the value happens all the time.  I also put in light blue grid lines every 32 pixels to keep you oriented.

Just looking at this byte coincidence pattern can tell you a lot about a file.
binary zeros: note the black dot in the upper left at (0,0).  This is because every byte is zero.
correlation image for zeros.ppm
hexadecimal ASCII: numbers, lowercase letters, and newlines.
correlation image for hex.ppm
base64 text: lowercase, uppercase, punctuation, and newlines.
correlation image for base64.ppm
HP Lovecraft text: typical English text.  Note mostly lowercase, plenty of spaces.  Note the asymmetry around capital letters--Capital-lowercase occurs much more often than vice versA.
correlation image for lovecraft.ppm
Wikipedia XML: more high ASCII/unicode, more punctuation, more complex structure.
correlation image for wikipedia.ppm
tar-gzip file: Note classic binary fill-everywhere pattern.  White dot is intriguing.
correlation image for tgz.ppm
zip file: similar to tar-gzip.  Biased toward lower numbers.
correlation image for zip.ppm
bz2 file: much less biased (better compression), although patterns still visible.
correlation image for bz2.ppm
JPEG image: weird fine horizontal structures
correlation image for jpeg.ppm
MP3 Audio: relatively few heavily used codes.
correlation image for mp3.ppm
/dev/urandom: almost perfectly uniform, except for random correlations.
correlation image for random.ppm
RC5 with 0 rounds: the straight line indicates perfect predictability.  This is not good encryption.
RC5 histogram, straight line
RC5 with 3 rounds: better, but still clearly non-uniform
RC5 histogram with 3 rounds, interesting patterns
RC5 with 6 rounds: looks quite uniform to me.
RC5 histogram with 6 rounds, solid black
AES-128 in CBC mode: looks perfectly uniform to me, even though we were encrypting just binary zeros.
correlation image for AES CBC
AES-128 in ECB mode: uh-oh! That ain't random!
correlation image for AES ECB